OpenDDS - Performance Testing Results
Latency Details
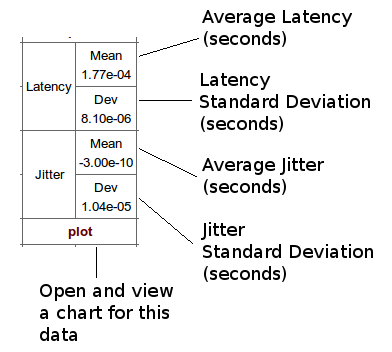
The results of executing the latency tests are included in the table below. The table is organized with rows of transport types and columns of message size for each test executed.Each transport and message size combination in the table below contains information about the latency and jitter for that test. The 'plot' links are to quad-plots of the individual test run results. These include a timeline plot for both latency and jitter as well as histograms of the latency and jitter measurements.

The plots for each individual test include two timelines and two historgrams - one each for latency data and one each for jitter data. The timeline plots show that actualy measured values from the test execution. The histograms show the data collected and segregated into 25 bins with frequency per bin plotted versus the center value of the bin.
For latency plots the average value indicates the most likely latency to be encountered for the test conditions. The standard deviation gives a measure of the variability or "spread" of the data for those test conditions. Note that the histogram of latency delay values is clearly not Gaussian, so the standard deviation has little value other than for comparative purposes. The actual distribution appears closer to a Rayleigh distribution, which is not unexpected.
For jitter plots the average indicates the most likely jitter value to be encountered for the test conditions. We expect this to be zero for all cases, but since we have a finite number of values, the actual average is sometimes not exactly zero. The actual average values can be seen to be very close to zero increasing confidence that the actual average is 0. The distribution of the jitter values appears to be Gaussian and the standard deviation measure can be used to evaluate performance in the different conditions.
Both the latency and jitter plots show that there is some additional activity on the host at indeterminate times. This is the result of executing on a time shared host without a real-time operating system. Execution on a host with a real-time operating system and scheduler would allow the system designer the ability to determine when, if at all, these additional tasks would affect the distribution processing.