OpenDDS - Performance Testing Results
Latency Results
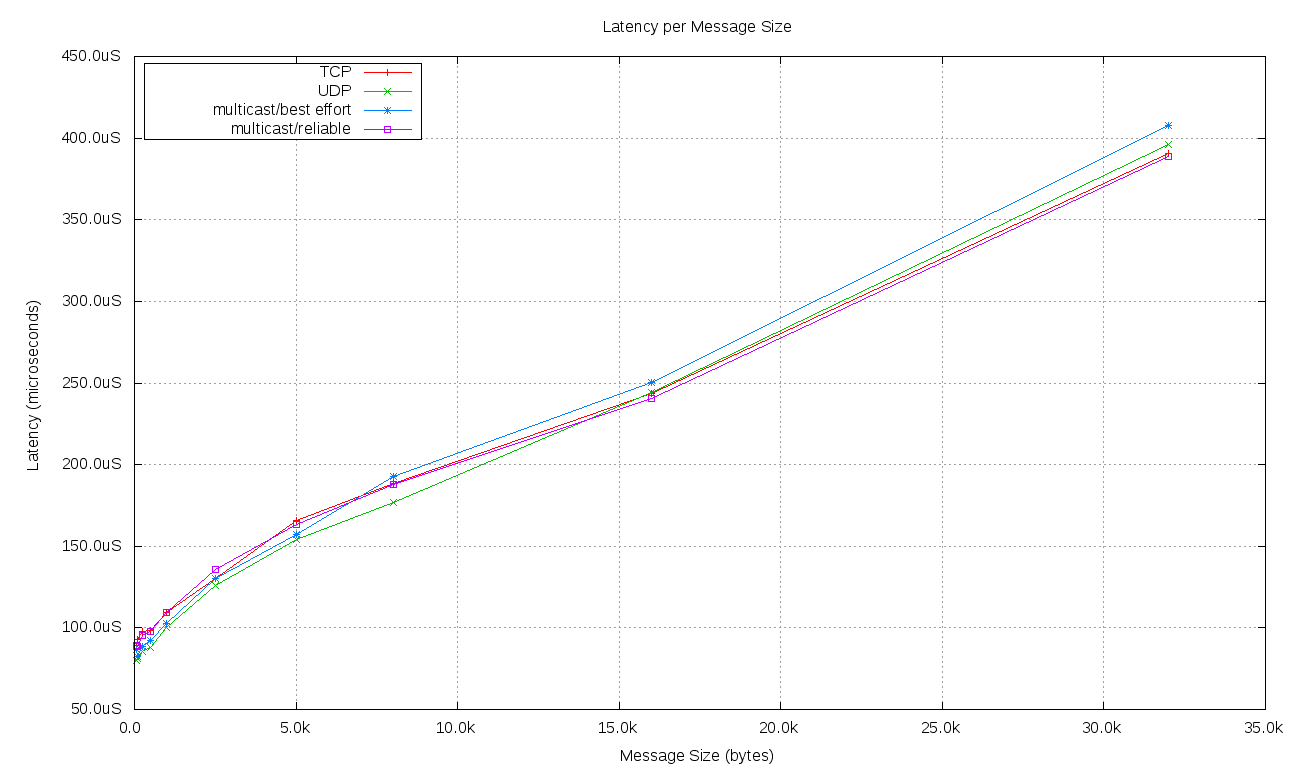
The results of executing the latency testing are included here. More detailed information is included in the Latency Details table. These results include latency and jitter. These tests were executed on time shared hosts with other system activity present. Executing on hosts with real-time operating systems and schedulers would allow the system designers to choose how the processing for data distribution and applications would interact and reduce the jitter to the levels required by the system.Latency for the TCP, UDP, best effort Multicast, and reliable Multicast transports are shown in the diagram below. Latency was measured by taking a timestamp in the originating process, inserting that timestamp into the data sample and sending it. When the data sample is received in the terminating process, another timestamp is generated and the latency is defined as the different between these two timestamps. This means that the latency numbers include the OpenDDS transport latency plus the system and network transport latencies plus the time to copy the entire data sample since the timestamps are from the start of sending to the end of receiving. The time to copy the message bytes is what causes the latency charts below to have a linear aspect over the message sizes, since as the message size increases, there are more bytes to transport.
Since the latency tests were not stressing the network or the hosts capacities, the performance for all of the transports is comparable. This is to be expected as the performance of the reliable transports without rate limiting (TCP) or packet loss (reliable Multicast) means that the latency is dominated by the underlying IP datagram transport performance.
The latencies below are in microseconds and are plotted against the size of the message being sent.

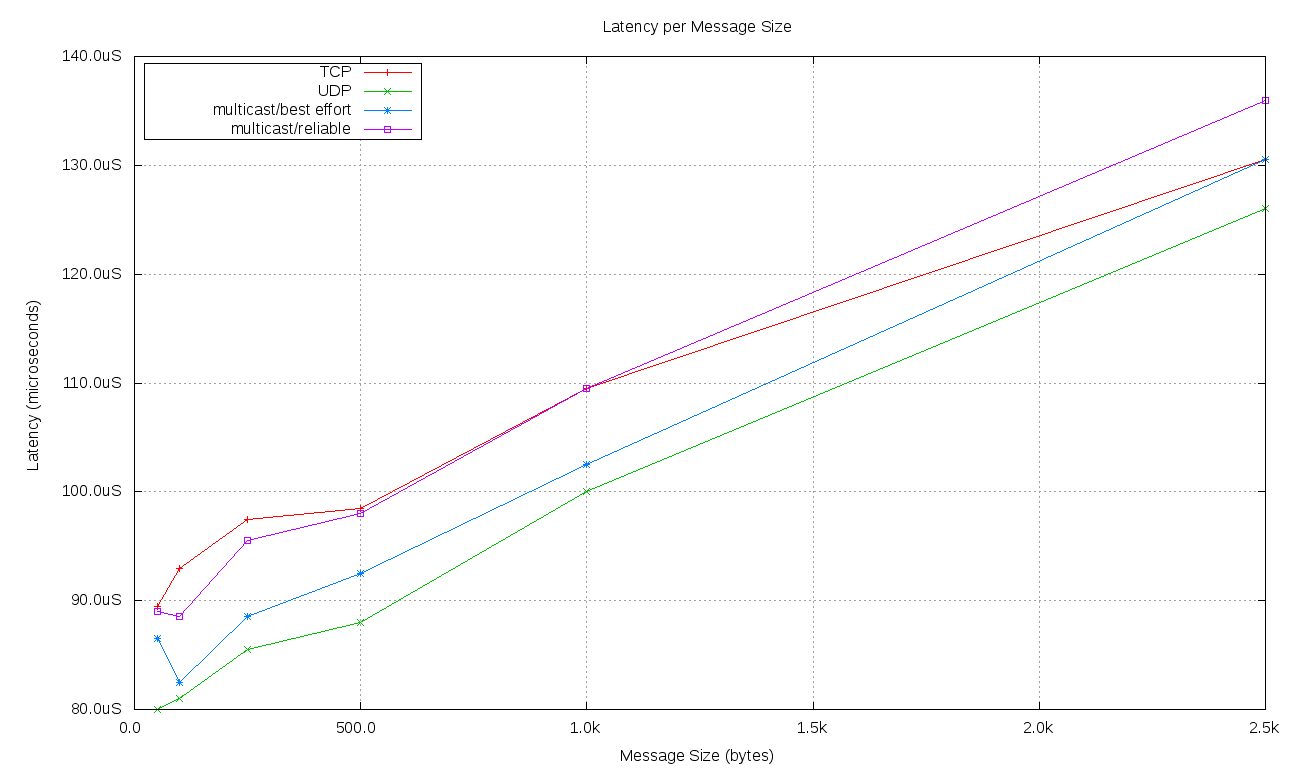
The following diagram is a more detailed look at the smaller message sizes of the previous chart.

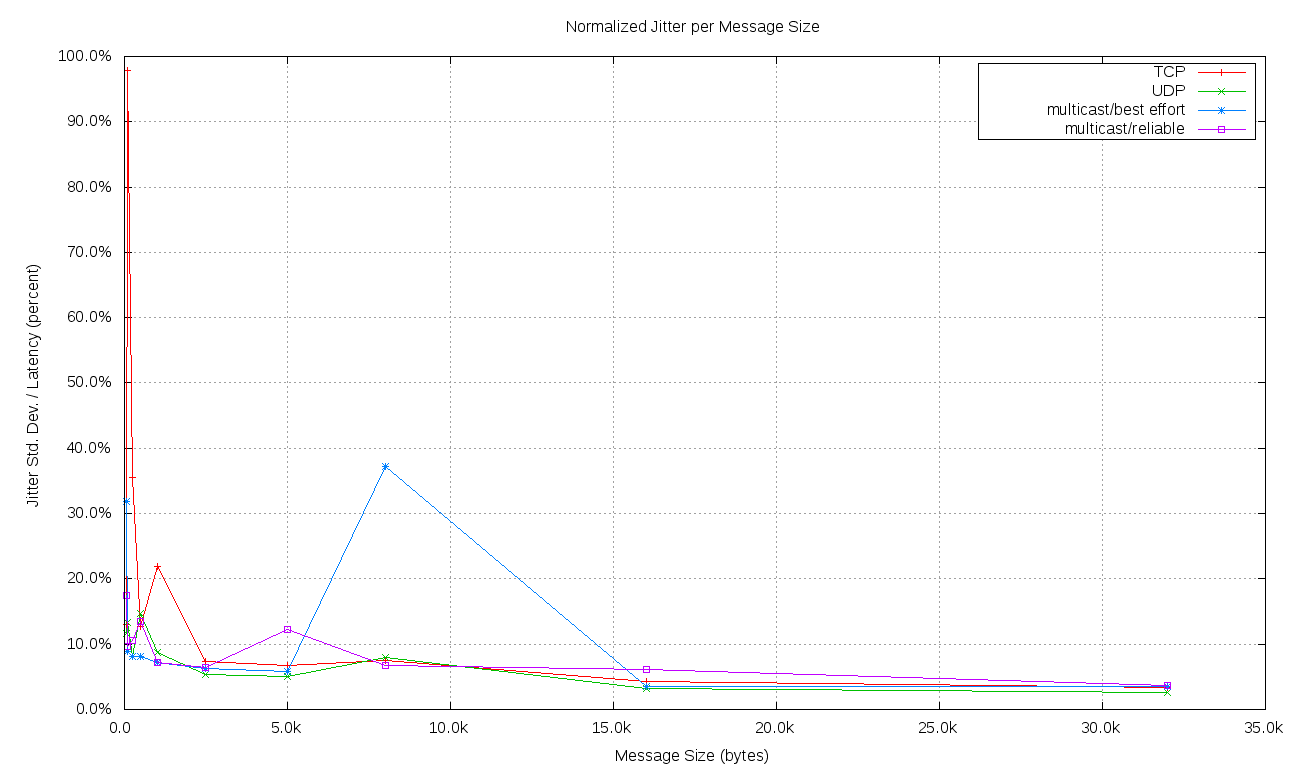
Jitter is defined as the time variation of latency on successive samples. These tests were executed on time shared hosts with other system activity present. Executing on hosts with real-time operating systems and schedulers would allow the system designers to choose how the processing for data distribution and applications would interact and reduce the jitter to the levels required by the system. Jitter is plotted below as a percent of the latency for each message size.

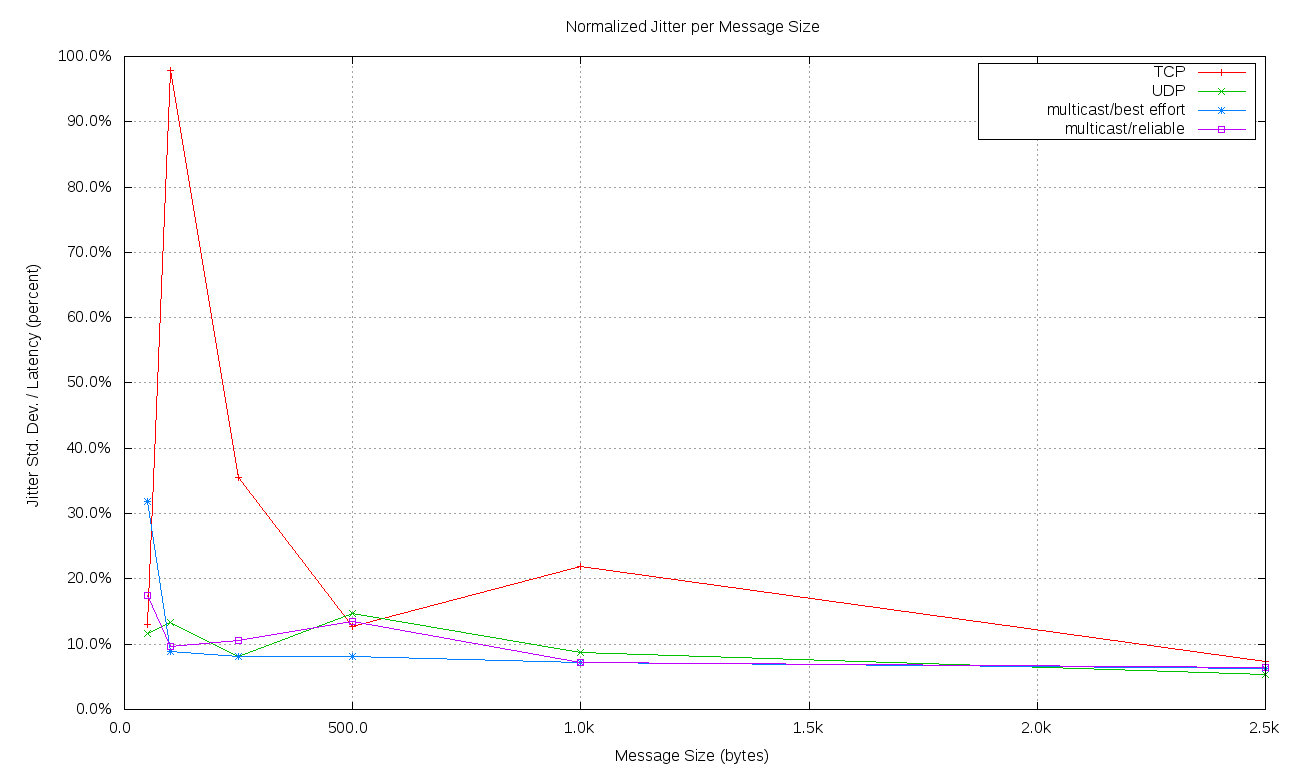
The following diagram is a more detailed look at the smaller message sizes of the previous chart.

$Id: latency_results.html 53 2010-01-30 23:51:02Z martinezm $